Optimal asset management strategies for mixed transit fleet
This blog is based on the research “Optimal asset management strategies for mixed transit fleet” published in the Transportation Research Part A: Policy and Practice in the following link: https://doi.org/10.1016/j.tra.2018.08.013
Keywords: Integer Linear Programming, Resource Allocation, Mixed Transit Fleet
1. Introduction
Local transit agencies own and operate an extensive number of revenue vehicles to provide sufficient transit coverage both in area covered and frequency. However, these vehicles need routine maintenance, rehabilitation, and replacement as they age. From a survey in 2012, public transit agencies spent upward of $17.0 billion on capital investment and 36% of which is federal funding. Through the Fixing America’s Surface Transportation Act issued by the Federal Transit Administration, transit agency needs to report an asset maintenance plan detailing what maintenance project is implemented and when for every vehicle.
A complete replacement can be beneficial in terms of improving the quality of service, but agency usually cannot match such fund. On the other hand, timely rehabilitation extending the vehicle’s useful life by a few more years might appear as a temporary solution. In addition, the heterogenous nature of fleet type add another layer of complexity to this problem. Therefore, the objective of this research is to “develop a framework for allocating funds to several constituent agencies where each agency varies in number of vehicle and bus type, and how to define a strategic maintenance plan (what project to perform and when for each bus) across a time planning period”.
2. Methodology
This problem can be formulated as a mixed integer linear programming (MILP). The decision variable is a binary variable indicating whether a maintenance project is implemented on a bus at an exact point of time. In order to evaluate the effectiveness of the asset maintenance plan, two metrics are introduced namely Total Passenger Miles (PSM) and Total Remaining Life (RML). Everytime a bus’s life is extended, it can carry more passenger over the distance that it covered and by multiplying these two variables we get the PSM value. This value is more reflective of the service performance since it prioritizes bus route with higher number of passenger and distance and hence is more impactful. RML simplys mean the total life added to the fleet after all maintenance. We build two models to represent of which objectives are maximizing PSM and RML respectively. Several constraints are included but the importants are state budget, a bus must receive maintenance when it reaches 0 RML, and the same rehabilitation cannot be done twice before the bus is replaced.
3. Case Study
The framework is applied on the state of Tennessee case study including 15 local transit agencies with a fleet size of 254 vehicles and a state budget of $5 million per year. Figure 1 and 2 show the result of our framework. Transit agency varies in size and number of passengers and thus, the amount of fund distributed varies accordingly. Nashville is the capital city of Tennessee with a vibrant and busy city life and it receives the most funding, followed by Memphis, Knoxville, and Chattanooga.
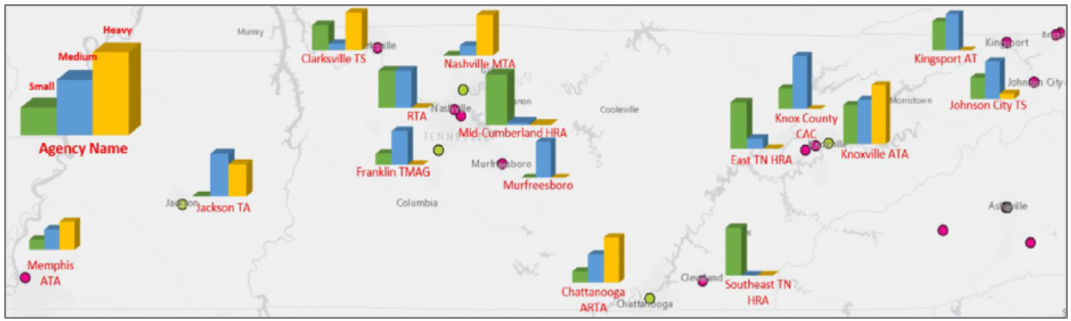
Figure 1. Geographical locations and fleet composition of transit agencies
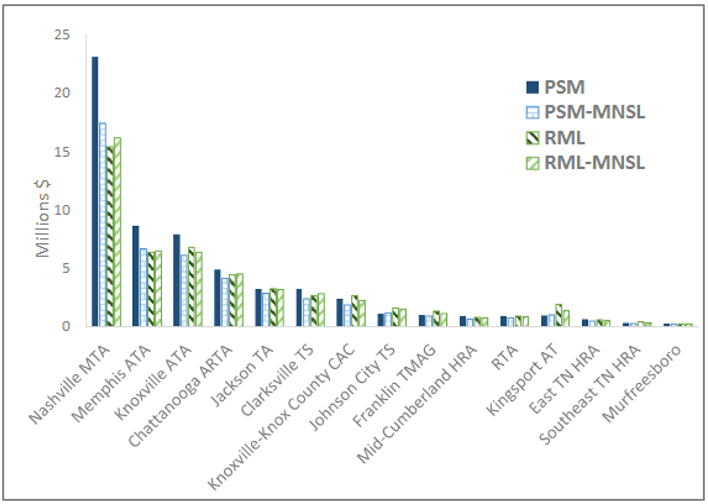
Figure 2. Funding Allocated by Transit Agencies in Tennessee
Author's Contribution in this project
The research’s concept, methodology, and analyzing are chiefly completed by the author. The author is greatly assisted in the writing by the two co-authors. The project is coded in MATLAB and the General Algebraic Modeling System (GAMS).