Memphis Area Transit Authority's Asset Management
Sponsored by the Memphis Area Transit Authority.
Keywords: Transit Asset Management, Power BI, Optimization, Database Management, Communication and Collaboration, Field Work.
1. Introduction
Memphis Area Transit Authority (MATA) is the public transportaiton provider for the Memphis area by offering three main type of services which are: (1) Fixed Route Buses; (2) On-demand Transit; and (3) Trolley. Fixed route buses provide routine service to a 300 square miles area and 750,000 people with annual ridership up to 7.2 million. On-demand transit aims to focus on people with disability whereas trolley have been a main tourism attraction in the city.
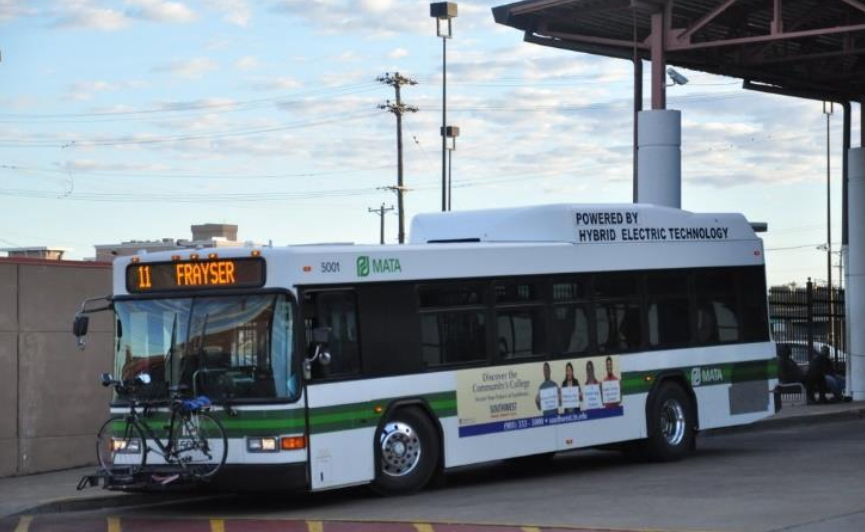
Figure 1. Example of MATA fixed route transit bus

Figure 2. Example of MATA Trolley
2. Methodology
Upon reviewing the state of practice for TAM (i.e., guidelines, other agency’s TAM, especially the guidelines in TCRP report 172), the following procedure is identified to deliver this project:
-
(1) Inventorying all asset: This step requires personnel to visit MATA headquarters and talk with different departments (i.e., revenue vehicle, maintanance and garage, system and furniture) and inventory the necessary asset. By consulting the FTA guideline and MATA peronnel, an asset hierarchy is created and tailored for MATA’s current inventory from which the asset can be categorized. For each asset, interested field are date of purchase, cost, asset type, description, and useful life.
-
(2) Assessing asset condition: Since asset vastly differs from one another by type, a specific metric is created and calculated for each asset type. For example, a bus can be evaluated by its Remaining Life, Usage Percentage, or Accumulated Mileage whereas a bus station is assigned a Condition Rating value based on a survey from field observation. However, all assets have one metric in common which is %Beyond Useful Life Benchmark which tells how many assets can no longer perform to its design function due to exceeding its own useful life.
-
(3) Asset Maintenance Plan: Each asset has different maintenance need throughout its lifetime which is defined by the lifecycle policy. A bus needs to get its transmission serviced once every 70,000 miles or 7 years which ever come first, or a Building may need to be refurbished once every 12 years. The problem increases in complexity where MATA have upward of 900 assets to manage and these maintenance projects should be selected and scheduled strategically. In addition, some maintenance project is more urgent and important than others as can be described by a Prioritization Index (PI) The problem can be sufficiently defined as follow: “Over a time horizon (e.g., 5 years), given a constrained budget, how to develop a portfolio telling what maintenance to do and when for each and every asset with an objective of maximizing the selection of prioritized project”. This problem is then formulated as a mixed integer linear programming (MILP). The result of this problem is the Asset Maintenance Plan
-
(4) Decision Support Tool: we develop a software aiding MATA in creating this Asset Maintenance Plan. In addition, a cloud-based database is created for MATA accompanied by a dashboard representing the summary of asset inventory and condition. An example of which is shown in the Figure 3below (simulated data is used due for this figure instead of MATA’s data).
-
(5) Compile every element discussed above to a single TAM plan.
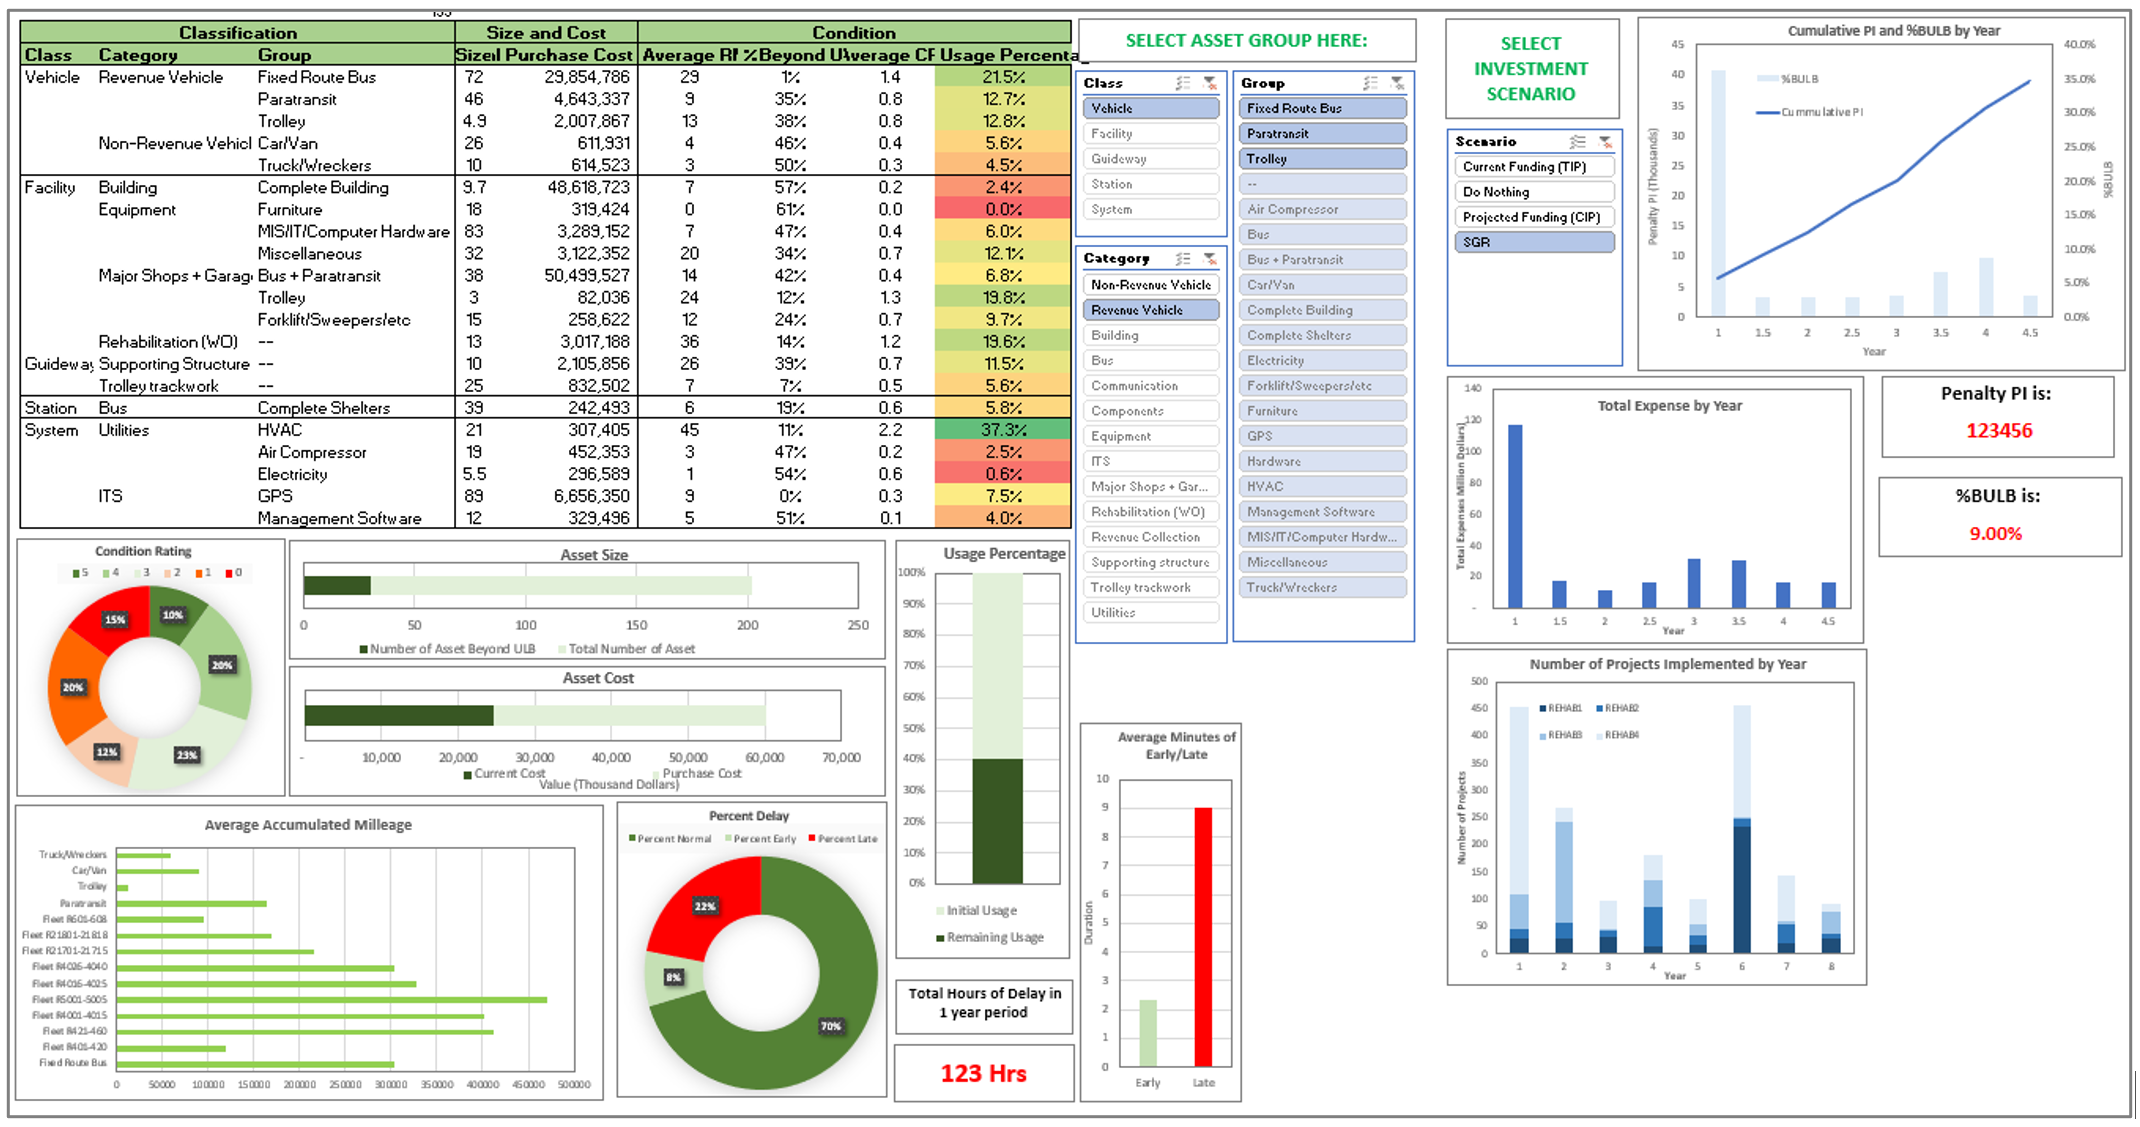
Figure 3. Example of a Dashboard monitoring asset inventory and health
3. Conclusion
This project started in 2018 and the first version of TAM plan was written. By the following years, new element and methodological contribution are incrementally added and updated to compile the new version.
Author's Contribution in this project
The author worked on and delivered every step mentioned above from the start to finish under his advisor’s supervision. The author is assisted in the asset inventorying and data gathering step by another student. All progress meetings with MATA board of director are prepared and presented by the author.